Who Gets Access to Reliable Connections?
Investigating the Relationship Between Population and Network Latency, and the Utility of Low-Earth-Orbit Satellite Constellations
Background
The purpose of this website is to display the visualizations that
support the claims made in our final report. We wanted to create two main sources of knowledge.
The first was the report, containing our key text, data, and findings.
The second was the website, containing our visualizations.
The goal of this project is to explore the relationship between population, connection speeds,
and access to internet. We deal with two problems, slow speeds in rural areas and access or no
access to internet. We hypothesized that servers in more populous areas would have faster
ping times. We also design a solution to solve the problem of access to internet worldwide
using a low-orbit satellite constellation. The main metrics we use are Round Trip Time (RTT) and
research based on Starlink satellites.
Round Trip Time (RTT) is the amount of time it takes for a signal to be sent,
plus the amount of time that it takes for that signal to be acknowledged.
RTT is an important measure of network reliability, and focusing on population size will
allow us to determine where network infrastructure can be improved.
Recently, The U.S. Federal Communications Commission granted SpaceX approval to launch as many
as 12,000 Starlink satellites to low Earth orbit, providing customers with high-speed,
low-latency internet in many parts of the world.
Population and RTT in Locations Around the World
The size of each dot corresponds to the relative population size. Red dots indicate slower ping
times from Cambridge, MA and green dots indicate faster times.
Internationally, locations farther from Cambridge tend to have slower RTT.
Hover over the dots to see the exact miliseconds
corresponding to each location.
Population and RTT in Locations Around the World
Here we provide more information about the specific international locations we looked at beyond
the information above which displays their latitude and longitude.
Look over each country to see the city and its relative information. Again, the color green refers
to faster ping times, while the color red refers to slower ping times.
Hover over the bubbles to see the location name, population size and ping time.
The Importance of Location
At first glance, the visualization would suggest that the more populous a place is, the slower the
ping time. At first this shocked us, then realizing that a lot of this was affected by the location
of the cities and towns we were pinging.
The purpose of this section is to take into account how location impacts ping time moving on. This
also serves as a place to explore some of the most populous locations and how RTT is affected there.
Cities far away from Cambridge naturally have large ping times because of distance. We parsed
through this data and noticed that the true result of this project was hiding behind the location
parameter. Go over to the next slide to see the results.
Hover over the bubbles to see the city name, population size and ping time.

Ping Times by the Type of Location Pinged
Looking at ping times by their respective location and weighting them against each other,
we discovered an inverse relationship between round-trip time and population and thereby
confirmed our hypothesis.
In the United States the average ping time from Cambridge, MA to rural areas was 52.58% greater than
the ping time to US major cities. The average ping time to rural towns is 95.51 ms and to major
cities 62.59 ms. International locations have longer average ping times than either rural or urban
US locations with an average of 182.91 ms. Overall cities with larger populations did not correspond
with shorter RTT because distance also affects RTT.
International major cities also had faster ping times than international rural locations within
close proximity, meaning this is a real disparity.
The Utility of Low-Earth-Orbit Satellite Constellations
To the left we have provided a video of our proposed solution to solve the problem of access to
internet worldwide using a low-orbit satellite constellation.
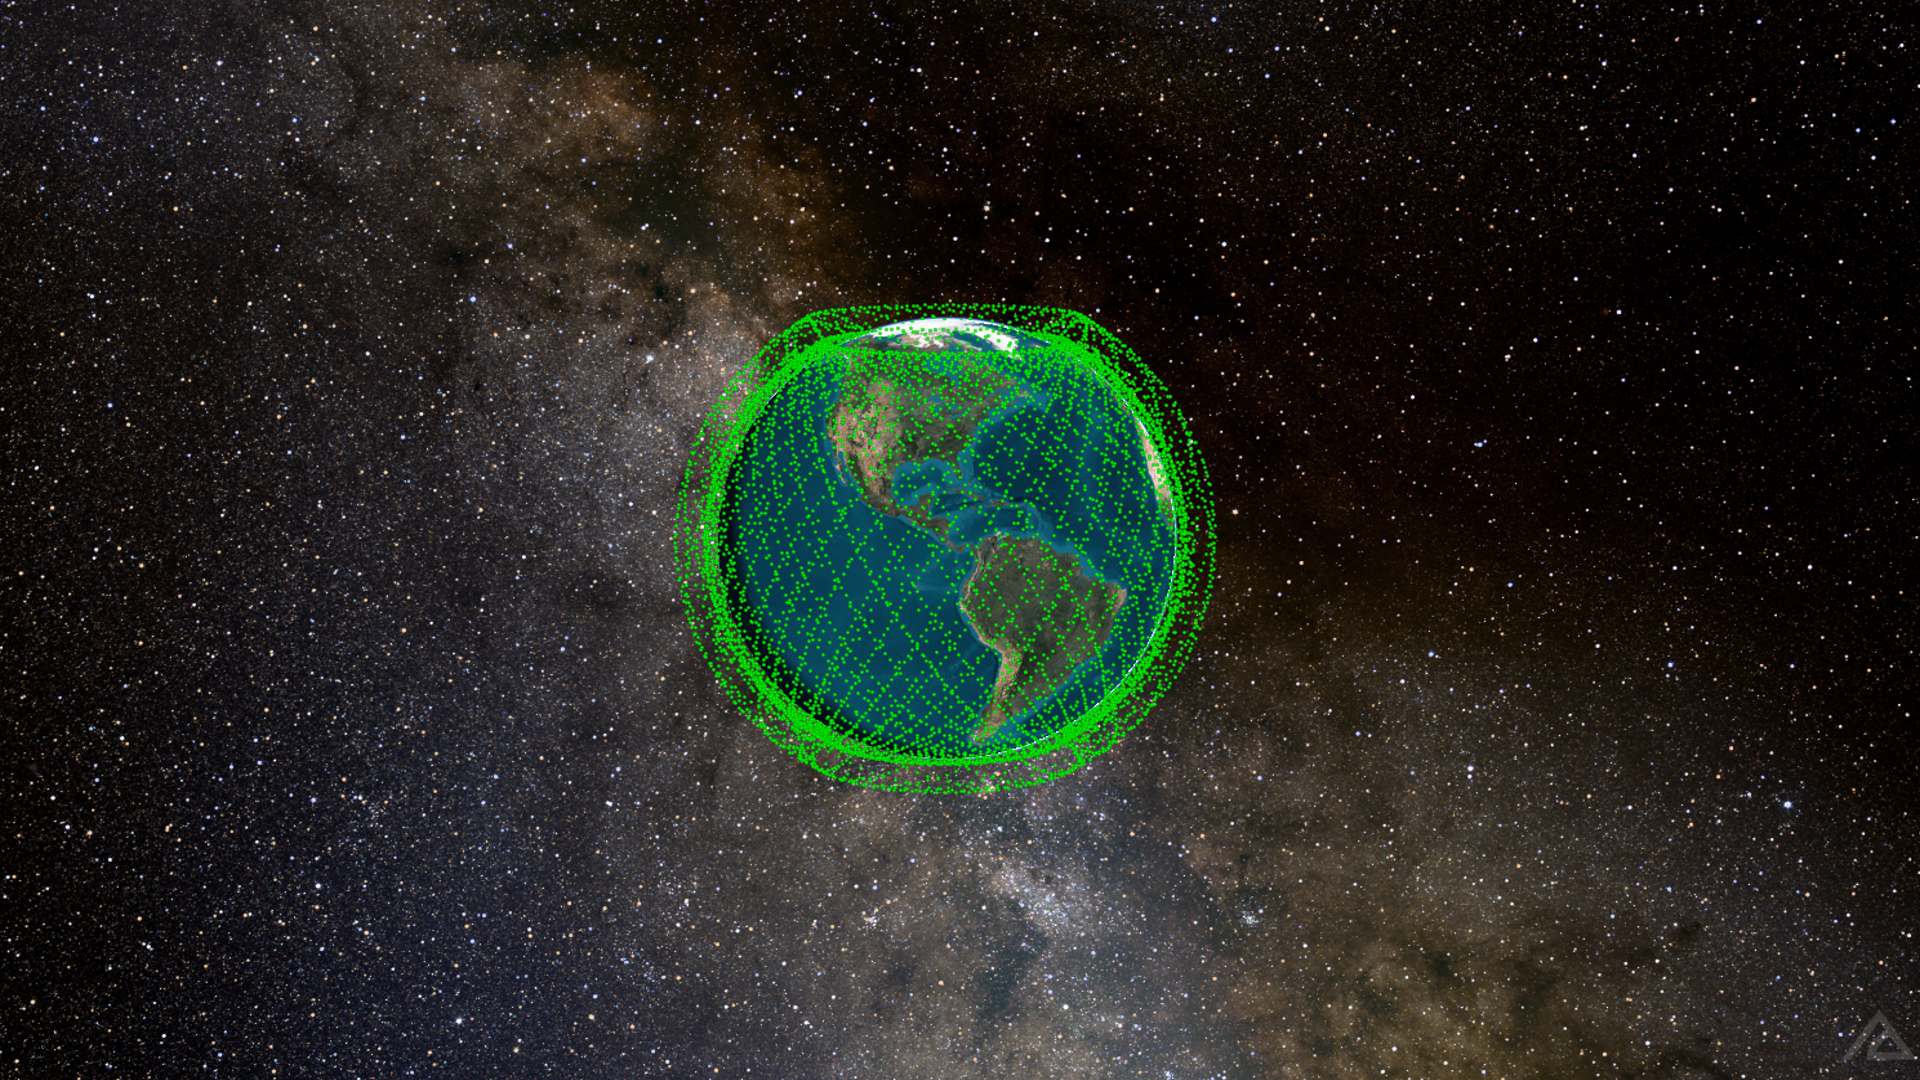
To the right, we have an image of the constellation. We go into the specifics of how it works and
why it would be effective in our final report.
Satellite Constellation in Action
Satellite Constellation in its Entirety
The Utility of Low-Earth-Orbit Satellite Constellations
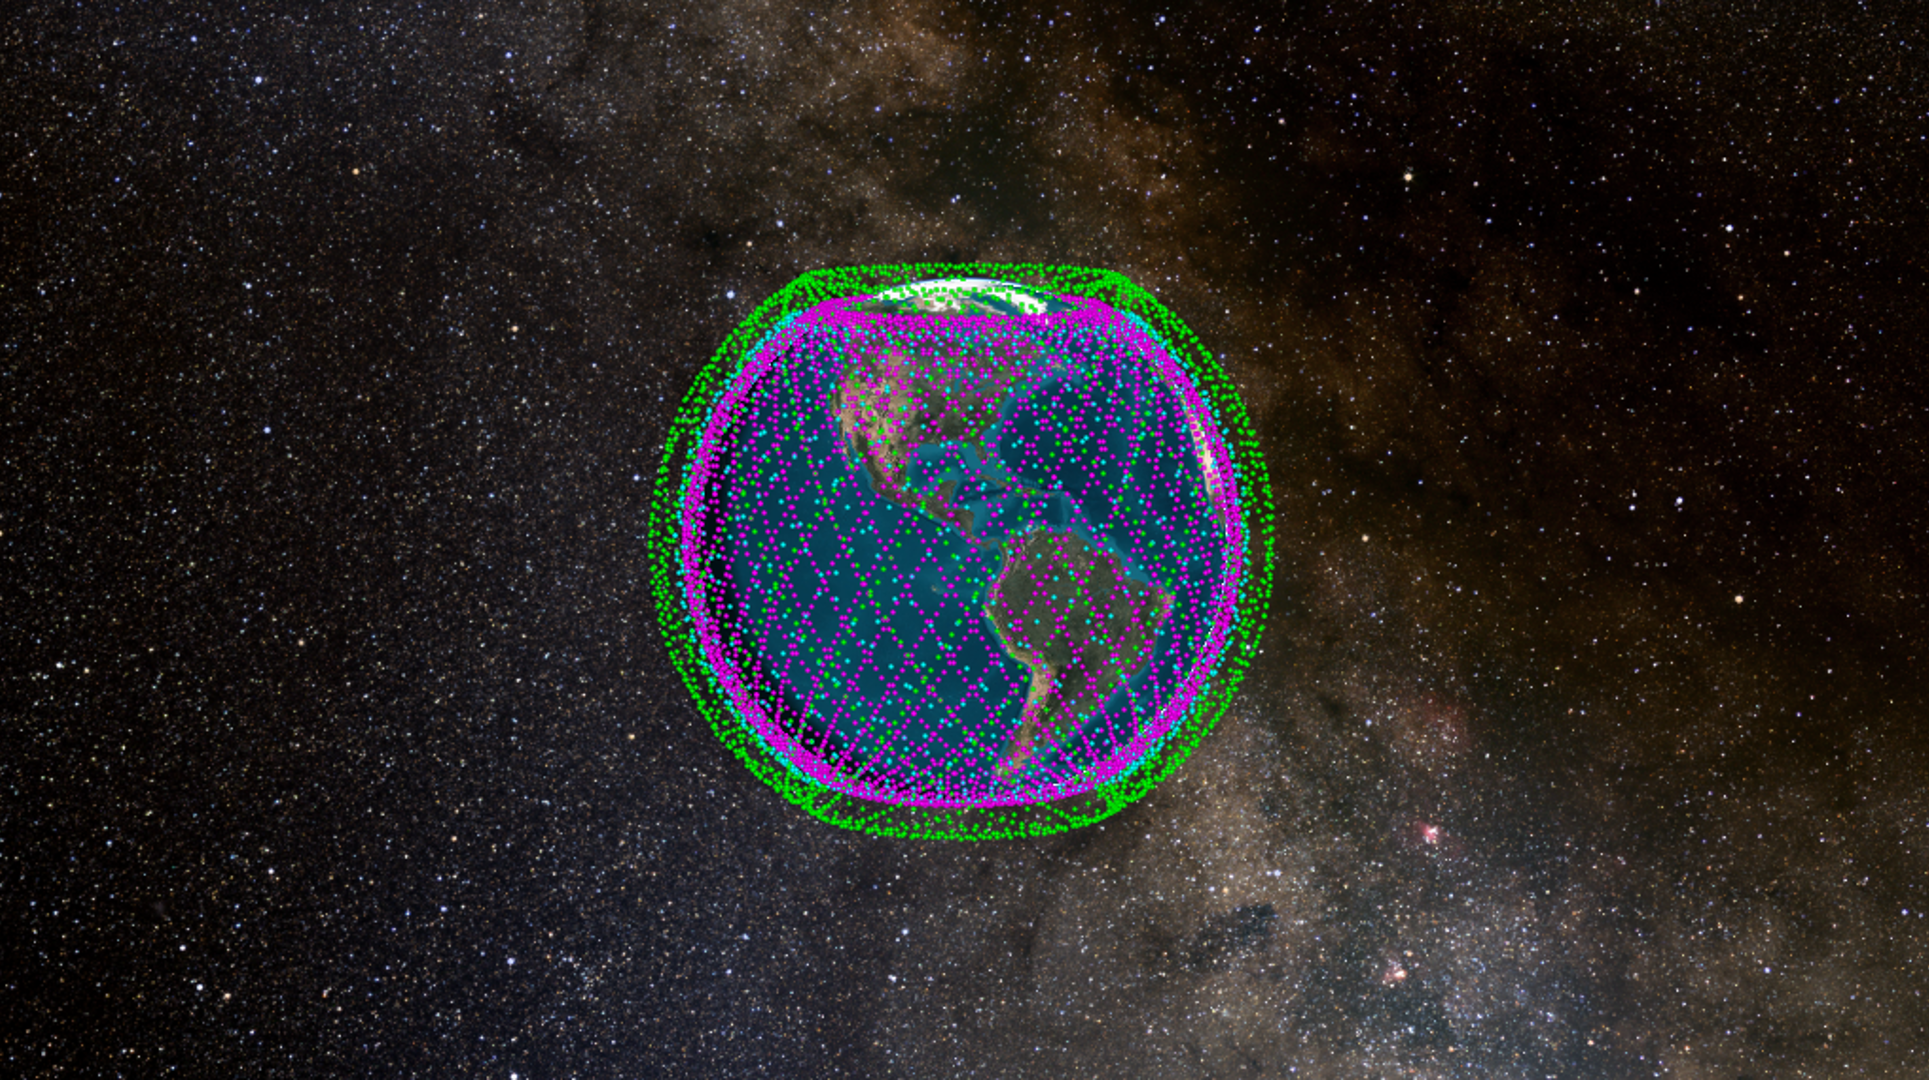
The Layered Satellite Constellation shows each of the constellation's three shells
(properties outlined in the report).
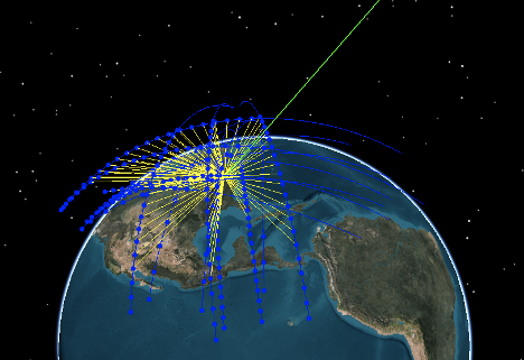
In our communication model, relevant satellite orbits are shown in blue, interference links are
shown in yellow, and the link between the ground station and geostationary satellite is shown in
green.
Layered Satellite Constellation
Communication Model
Conclusion
Because of varying internet speeds, we sought to explore and visualize the relationship between
population and network latency. Hypothesizing that more populous areas would experience lower
network latency, we pinged servers in both rural and urban areas and noted the round-trip time of
each ping. Ultimately, we discovered an inverse relationship between round-trip time and population
and thereby confirmed our hypothesis.
Our low-orbit satellite constellation serves as a potential solution not necessarily to the
aforementioned variation in network latency, but to the widespread lack of internet access.
We hope to have had a contribution, even if small, to the research around network reliability
and access by providing a new perspective, namely how population affects round trip time, as well
as a hopeful solution to the large disparity we found.
About Us
This was a final project for Harvard's CS143 course in fall 2020. It was created by Adelson Aguasvivas, Madison Harris, Dominic Garrity, and Santy Mendoza.